Showing posts with label climate change. Show all posts

Friday, February 1, 2019

Wetlands around the world protect communities while helping fight climate change


Triple Creek wetland restoraiton site in Okanogan County in May 2106 (left) with high cut banks and restoration site in April 2018 after critical restoration work put in place.
When the Triple Creek wetland restoration effort began (left, 2016), vertical cut banks of up to 10 feet kept Myers Creek disconnected from its floodplain. After building structures that mimic beavers, the cutbanks are dramatically reduced and the water much closer to the floodplain (right, 2018). Photo courtesy Julie Vanderwal, Okanogan Highlights Alliance.
As the world grapples with climate change, those commemorating World Wetlands Day Feb. 2 are highlighting the importance of restoring, conserving, and wisely using wetlands because they can help reduce floods, relieve droughts, and buffer coastlines from extreme weather.


World Wetlands Day logo.
In the state of Washington, we work every day to protect and manage wetlands. The environmental and economic benefits they provide nature, our communities, and way of life are immeasurable.

More likely than not, there’s a wetland near where you live, work, or play. Our state mandate is to ensure Washington does not lose any more acres of wetland and the functions they provide—as well as restore, enhance, and preserve these important resources.

Wetlands: a natural solution
Wetlands provide important habitat for salmon that Washington’s endangered resident orca whales need to survive. We fund riparian restoration work in agricultural areas to benefit salmon.

Wetlands also help filter and clean our drinking water. They control flooding and erosion while providing habitat for other fish and wildlife species. Washington’s wetlands help maintain a safe, healthy environment and economy.


Wetland connected to Little Spokane River.
Wetland connected to Little Spokane River.

In Washington, we recognize the harm climate change can have on wetlands—from sea water intrusion to water chemistry changes to even being the source of greenhouse gases when improperly disturbed.

There are also numerous ways wetlands help us cope with climate change including sequestering or storing:
  • Carbon efficiently while emitting little methane.
  • Twice as much carbon in coastal wetland soil than in all the world’s tropical forests.
  • More carbon than they emit as wetlands mature.
  • Large amounts of carbon in tree biomass, especially forested wetlands.
  • Up to 700 billion tons of carbon around the world—including 96 million tons of carbon every year.
  • Water that is released later in the season to mitigate the effects of drought.
Washington community helping restore degraded wetland system

Many state residents are passionate about protecting existing wetlands while others are getting their hands wet and dirty, working hard to restore wetlands that have been degraded. There’s no better example than the Triple Creek wetland restoration project in north-central Washington.

Located on Myers Creek in Okanogan County near the town of Chesaw, the Triple Creek project is part of a privately-owned forested wetland named after three main creeks: Myers, Bolster, and Thorp.


Triple Creek wetland restoration site located near Canadian border in Okanogan County, Washington.
Triple Creek restoration site in
Okanogan County
Historically, Myers Creek cyclically spilled over its banks and inundated the Triple Creek floodplain, including a series of beaver ponds on the creek. However, the stream lost its connection to the floodplain in the late 1990s after a rain-on-snow event combined with other factors and left an incision trench with left vertical cut banks of up to 10 feet.

The beaver ponds became breached and drained, no longer providing grade control or covering large areas of the floodplain. As the now-drier soils started favoring invasive plant species, a thriving great blue heron rookery was abandoned and the wetland became less able to filter and store water.

Triple Creek land stewards join local, state, and federal partnership


Triple Creek in Okanogan County
Triple Creek in Okanogan County.
The Triple Creek land stewards, who invested in 500 acres together, were disappointed to see a large part of their thriving wetland dry up. After exploring a variety of restoration options, the group selected the local non-profit entity Okanogan Highlands Alliance (OHA) to lead the restoration effort.

OHA, in partnership with Trout Unlimited, U.S. Fish & Wildlife Service, and the National Oceanic and Atmospheric Administration’s Northwest Fisheries Science Center, worked with the land stewards to find the most cost effective ways to address the wetland degradation. The team seeks to improve hydrologic connectivity between Myers Creek and the adjacent wetland, improve fish and wildlife habitat including re-establishing beaver, and restore native wetland vegetation.

OHA secured community-based, federal and state funding—including funds from the settlement agreement reached between Ecology and the owners of the Buckhorn Mountain gold mine for environmental remediation. In addition, local groups, clubs, students, and community members have so far provided more than 1,400 volunteer hours to help restore the wetland.

Engineered beaver dams helping restore Triple Creek wetland

Left to right images from August 2016 to May 2018 showing restoration teams installing human-made beaver dam structures in Myers Creek, and stream rising to reconnect to floodplain by May 2018.
From left to right: In August 2016, Triple Creek restoration team installs structure mimicking a beaver dam. In May 2017, the red arrow would be underwater as the structure is overtopped. In August 2017, the structure is adaptively managed to extend its functional life. By May 2018, Myers Creek comes close to spilling over its banks onto the floodplain. Photo courtesy Julie Vanderwal, Okanogan Highlands Alliance.
The restoration team is focused on reducing the severe stream channel incision that disconnected Myers Creek from the floodplain. The project design mimics the work of beavers by using lines of wooden posts that are woven with branches to slow and redirect stream flows as needed. The structures help capture sediment to build the streambed back up and raise the water table. They also help make the channel longer while reducing its slope, making the system more stable.

By emulating the effect of beavers to slow stream flows, capture sediment, and connect the water with the land, the project aims to improve water quality and increase water storage capacity. Re-establishing beavers, and the plant life they need, is a key component of mitigating local drought and fire issues—increasing resilience to climate change. Wetlands help store water that becomes available later in the season to support streams and underground sources of water, and to offset the effects of drought.

Triple Creek wetland project achieving success

The first structures were installed in the field season before two years of intense flooding, creating optimal conditions for transforming the site. As Myers Creek interacts with the human-made beaver dams, the team's objectives for the stream are being realized more rapidly than expected. In places, the streambed at the site is more than four feet higher now than when work started in 2016—with a 23 percent increase in the overall channel length of Myers Creek within the project area.

Beaver at the Triple Creek wetland restoration site in fall 2017.
Beaver at the restoration site captured on wildlife camera in fall 2017. Natural beaver activity will be critical to long-term project success.

The team continues to repair and enhance instream structures and is dedicated to establishing a healthy riparian plant community. A diverse and robust buffer zone will not only improve native vegetation but will encourage beavers to recolonize the area, and modify and maintain the site into the future.

Beavers have already shown increased interest in the project site, starting just a few days after construction began in 2016. Beavers even wove a post line themselves in 2017, before the project team could get to it!

By Curt Hart, Ecology, and Julie Vanderwal, Okanogan Highlands Alliance

Friday, August 17, 2018

Ecology researchers study climate effects on Puget Sound food web

Unusual phytoplankton blooms caused by warm ocean water give scientists a glimpse into the future of marine life, from shellfish to whales.

By studying the effects of warmer marine water on the tiny plant-like organisms called phytoplankton, scientists at Ecology are learning how the Puget Sound ecosystem responds to climate change.
They did so when a mass of warm water nicknamed “the Blob” made its way to the Puget Sound in 2015. This unusually warm water gave scientists the opportunity to see what a world with warmer oceans might look like.
The Blob changed the timing and size of phytoplankton blooms significantly; spring blooms happened earlier than usual, and summer blooms were dramatically larger than in previous years.
2015 Blooms from Eyes Over Puget Sound
Most of the marine food web depends on phytoplankton blooms happening at certain times. Because phytoplankton are a key source of energy, their availability affects the life cycles of marine creatures.
Ecology’s Senior Oceanographer, Dr. Christopher Krembs, tells us more.
Krembs: “A lot of life cycles of invertebrates and fish are triggered by temperature. . . . for little larvae that come out of their eggs and for juvenile fish and other species, it is important that they find their food early on in their life cycle because most of the juveniles die if they don’t find optimal conditions.”
If phytoplankton blooms don’t align with critical developmental stages of marine creatures like small fish and krill, the entire food web can suffer. A healthy marine food web is essential to regional efforts to recover salmon and Southern Resident Killer Whale populations, as well as to support the commercial, tribal, and recreational shellfish industries.
Krembs says that the data from 2015 will help scientists model climate change more accurately.
Krembs: “When you see a scenario, you become much better at predicting the future, because now you have environmental data that you can calibrate your models with. And so our predictions become better.”
More research on how a warming climate may affect Puget Sound ecosystems has already begun. To learn more, visit Ecology’s webpage about the Salish Sea Model.


By Ruth Froese, Environmental Assessment Program Communications

Thursday, July 19, 2018

Eyes Under Puget Sound: Size matters—What can we learn from biomass and size classification?


Eyes Under Puget Sound
For the first time, benthic invertebrate biomass is being studied on a large scale in Puget Sound. What does this mean? Sediment-dwelling benthic invertebrates (benthos) live in the mud or sand at the bottom of Puget Sound; their abundance and diversity can help us assess the health of the sediment ecosystem. As it turns out, the size of the animals is also critical when evaluating ecosystem health. Recording these biomass trends over time will help us learn more about how organisms respond to environmental stressors linked to climate change.

Sediment sampling photos
LEFT: A sediment sample is collected using a double Van Veen grab. CENTER: Angela rinses a benthic sample though a 1 mm mesh screen. RIGHT: A benthic sample containing Molpadia intermedia, the Sweet Potato Sea Cucumber.


Making it count

Our Marine Sediment Monitoring Program has been identifying and counting Puget Sound benthos since 1989. Although a few studies have examined the biomass of particular invertebrate species on a smaller scale, large-scale monitoring wasn’t put in place until 2016, when we added a biomass and size-classification component to our program. This is important because we want to know how organisms respond to environmental stressors associated with climate change and nutrient enrichment. These stressors include changes in temperature and salinity, decreasing dissolved oxygen levels, and changes in food quality.


That’s about the size of it


Biomass is a measure of the amount of living biological tissue in a system, which can tell us about productivity, or how animals use and cycle nutrients as they grow. Calculating biomass is no small feat. It means weighing many individual animals in the lab, most of them very tiny. We have weighed over 6,500 creatures so far! After an animal is weighed, we categorize it into one of five species-specific size classes (small, medium, large, extra-large, and megafauna) based on its length. Megafauna are large animals like sea cucumber and crabs that weigh 2 grams or more; when we analyze our data, we look at these animals separately, since just one of them can greatly outweigh all the small animals in a sample.

Measuring benthos in the lab

LEFT: A marine worm is weighed to the nearest thousandth of a gram. CENTER: A tiny pectinariid (also know as the Ice Cream Cone Worm) is measured under a microscope. RIGHT: Size series of Astyris gausapata, the Shaggy Dovesnail.


Sneak peek

Map of benthic biomass based on water depth
Total benthic invertebrate biomass (in grams per 0.1 meters²) at 22
 Puget Sound stations sampled in April 2016. 
Shallow areas are indicated by lighter blue, 
while deeper areas are darker blue.
 Although it will take a few years before we can look at trends in biomass and size class over time in Puget Sound, we’ve already observed some interesting results from our 2016 data. These preliminary results were presented as a poster at the 2018 Salish Sea Conference in Seattle, and are now available online as an Ecology publication.

Some of the major findings include higher biomass in shallow areas like Bellingham Bay and terminal inlets, and generally lower biomass in deep basins (see map, right).
Communities with high biomass tended to have lower numbers of individuals and low diversity (meaning that a few large animals dominated, but there were not a lot of different species). Communities with the lowest biomass had the greatest numbers of individuals and were the most diverse (meaning there were many smaller animals of many different species). This shows that high biomass alone is not necessarily an indicator of a healthy benthic community. Overall, the top contributors to total biomass were stress-tolerant species of marine worms and small clams.

The sizes of animals and how they change over time may shed light on the effects that stressors have on the development of individual organisms, and how that relates to the long-term stability of benthic communities. We certainly have much more to learn from this exciting new dataset, so stay tuned!


By: Dany Burgess & Angela Eagleston, Environmental Assessment Program

Our benthic taxonomists, Dany and Angela.
Pictured left, Angela Eagleston;
right, Dany Burgess.

Our benthic taxonomists, Dany and Angela, are scientists who identify, count, and weigh the benthic (sediment-dwelling) organisms. They work as part of our Marine Sediment Monitoring Program team. Together, they track the numbers and types of species we see in order to understand the health of Puget Sound and detect changes over time.


Can't get enough benthos? See photos from our Eyes Under Puget Sound collection on Flickr.

Friday, May 25, 2018

Clean Air Month - Part 3


Last time we discussed concrete and practical ways to protect the air we breathe on a more personal level. In today's final blog, we’re looking at how our actions cumulatively impact the world. Our state is a leader in responding to climate issues. Learn more as we continue to celebrate Clean Air.

Clean energy
Concerns about climate change, the use of fossil fuels, and air pollution are accelerating clean energy development. Approximately two-thirds of Washington’s electric is generated from hydropower? Washington also ranks as one of the top nationwide producers of wind power. It’s also becoming more popular and affordable to use solar power for your home needs. 

Check with your local utility provider or find a clean energy non-profit group for possible incentives or grants. 

Use alternative transportation
Vehicle emissions are one of the main sources of air pollution in Washington. You can help reduce emissions by participating in the following: 

  • Share a ride with others, carpool, or take a bus.
  • Ride your bike. Your heart will thank you!
  • Don’t let your car idle.
  • Be the first on your block to buy a Zero Emission Vehicle (ZEV).

Drive an electric vehicle
ZEVs, or electric vehicles, are gaining in popularity and the savings to your pocketbook, health, and environment add up quick. Imagine not having to get an oil change or stop and pay for gas! 

Charging an electric vehicle is getting easier too! There is a significant effort to build the infrastructure to support the use of electric vehicles.

For example: the West Coast Electric Highway is an extensive network of electric vehicle (EV) DC fast charging stations located every 25 to 50 miles along Interstate 5 and other major roadways in the Pacific Northwest. Planning your trip just got easier with this map of Washington charging stations. 

If you are heading outside the Pacific Northwest you can check out the Department of Energy maps of electric vehicle charging stations and alternative fueling locations nationwide.

Keeping our mission alive
Air quality is vital to our agency’s mission to protect and enhance the environment today and for future generations. And you are a part of that mission as well – as businesses, industries, communities, families and individuals. Thanks for helping us celebrate Clean Air in the month of May!

By Kim Vaughn | Air Quality

Tuesday, October 18, 2016

Reynolds Smelter Cleanup/Millennium Bulk Terminals - Longview Update


There’s a lot happening at the former Reynolds smelter site in Cowlitz County’s industrial area this autumn. Some of it will be tangible, boots-on-the-ground work, but there’s also a tremendous amount going on behind the scenes. Although cleanup of the site and redevelopment are on separate regulatory paths, parallel progress is being made.

First an overview of what’s up with the site cleanup, then an outline of what’s happening with environmental reviews related to coal export proposed by Millennium Bulk Terminals – Longview.

Cleanup Action Plan

For almost three-quarters of a century, the site of the former Reynolds Metals Reduction Plant in Longview has hosted intense industrial activity. For 70 years, this property was an active aluminum smelter and continued to receive bulk shipments of alumina after the smelter closed in 2001. The ore continued on to a Wenatchee smelter.

For the past decade, most of activity at the site has centered on understanding and developing options for cleaning up the chemical contamination and waste byproducts left behind by the operations of the first 70 years. While working alongside the local community, property owners and Cowlitz County, the Department of Ecology has carried out a regulatory oversight role ensuring future cleanup will meet strict legal standards that protect people and the environment.

Rigorous studies and sampling of the site identified soils with elevated levels of fluoride, polycyclic aromatic hydrocarbons (PAHs) and total petroleum hydrocarbons. Testing has shown that the shallow groundwater at the site contains fluoride and PAHs.

The importance of cleaning up this site to the local community is reflected by the robust public engagement during the cleanup process. This includes local leaders, community members, tribal governments, the property owner Northwest Alloys, Inc., and Millennium, which leases the property. As a result, this complex cleanup is well-informed and comprehensive, as outlined in the draft Cleanup Action Plan, which Ecology expects to finalize later this year.

A thorough cleanup of this site is a high priority for everyone. Northwest Alloys, Inc., and Millennium are responsible for funding the cleanup. Once the final Cleanup Action Plan is issued and a legal Consent Decree is signed, cleanup can begin.

Columbia River Sediment Dredging

While investigating the site, Ecology found contamination in nearby Columbia River sediments. A small area of sediment is contaminated with PAHs.

In November, this pocket of pollution is scheduled to be dredged and sent to a landfill licensed to accept contaminated sediments. More information about the early dredging action is outlined in an approved interim cleanup work plan.

Clean, sandy backfill will replace the material that is removed.

Millennium Bulk Terminals-Longview Environmental Review

Separate and distinct from the site cleanup, Millennium is proposing to build and operate a coal export terminal on a portion of the site. Before any permit decisions can be made, Cowlitz County, Ecology and the U.S. Army Corps of Engineers must complete federal and local environmental studies.

The federal study is led by the Army Corps of Engineers and follows the National Environmental Policy Act (NEPA). The local study is being co-led by Cowlitz County and Ecology and follows the State Environmental Policy Act (SEPA). The two studies are on different timelines and both are required before local, state and federal permit decisions can be made.

Final SEPA EIS planned for Spring

The SEPA final Environmental Impact Statement (EIS) is a much-anticipated project milestone. After three public hearings that drew hundreds of people and an unprecedented 267,000 public comments, the draft study requires significant additional work before issuing it in a final form.

Cowlitz County and Ecology announced that they plan to release the final SEPA EIS on April 29, 2017, four months ahead of schedule.

NEPA Draft EIS Out for Public Review

On Sept. 30, the U.S. Army Corps of Engineers issued its draft EIS for the federal review required by NEPA. The 60-day public comment period on the federal draft study continues until Nov. 29. More information is available at the Millennium Bulk Terminals NEPA Draft EIS webpage.

There are also public comment periods for two federal permits related to the proposed coal export terminal that continue through Nov. 29. Read the joint public notice.

Recap

Cleaning up legacy pollution from large industrial sites is a big deal for any Washington community. For the Longview-Kelso region, the cleanup and redevelopment of the old Reynolds smelter offers important economic opportunities, and a chance to reclaim a contaminated site.

Cowlitz County and Ecology continue to ensure activities at the site, whether they are related to cleanup or a future use, are meeting local and state requirements.

Back in 1941, when the Reynolds smelter was manufacturing aluminum to build aircraft for the war effort, it’s unlikely that anyone imagined what the future of this site held; both the immense effort required to clean up the site, and the equally immense efforts from people of all walks of life to influence its future.

One thing is for sure: there is a lot of activity on the site. It’s a flurry of activity and it’s not even winter, and there’s much more happening in the months ahead.

By: Dave Bennett, Southwest Region communications manager


Thursday, January 28, 2016

Eyes Over Puget Sound: 2015 was the year of the jellyfish!

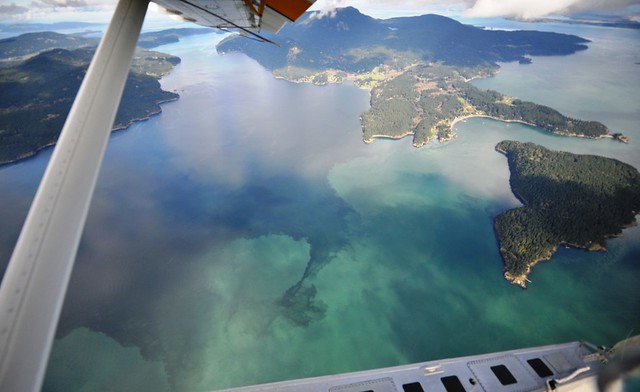
Our 2015 Eyes Over Puget Sound sampling year was marked by the Blob, colorful algae blooms and jellyfish galore. Take a trip through the past year in photos that tell the 2015 story of Puget Sound.

View the 2015 year-in-review report


January: Warm coast, clear Sound

We started out 2015 with the Blob lurking on our coastlines. The warm water had just started entering Puget Sound, and our mild winter left those waters a bit warmer than usual. Whereas a very cold winter would lead to a down-season for jellies, we noticed patches of jellyfish hanging around through the winter. While flying over the coasts, we saw phytoplankton blooms in the surf, which are uncommon to see so early in the year.

February: Rivers run high and more jellies

Remember how warm February was last winter? This led to large amounts of snow melting, gushing down our rivers and dumping water into Puget Sound. As a result, we observed a lot of sediment entering our waters from the Fraser River, which is one of the biggest influences to the Sound. The sunny weather, dry air and warm water also made our waters run green in areas due to our first signs of growing phytoplankton. We saw numerous patches of jellyfish lurking in the southern inlets of Puget Sound.

March: Unusually warm and even more jellies

Come March, we started to notice how unusual the year was shaping up to be. Abundant jellyfish patches were showing up in uncommon places for the winter, such as Totten Inlet. By this time, all of the major rivers that feed Puget Sound were running high as the mountains lost snow in response to our remarkably warm weather conditions. As a result, just three months into 2015, Puget Sound was dressed in brown.

April: Summer blooms and jellies arrive early

April brought some truly bizarre observations. The red-brown phytoplankton blooms we typically see in Puget Sound during late summer were already going strong. This painted areas such as Sinclair Inlet near Bremerton in swirling tie-dye patterns of brilliant red that contrasted with our bold blue waters. We also saw--you guessed it--more jellyfish! These jellyfish patches persisted through the spring bloom in large numbers.

May: The turning point for an extreme summer

Most of the rivers that feed into Puget Sound fell below their expected flows in May. The large rush of melting snow came early and faded quickly. This is the turning point when the Sound transitioned from lower-than-normal salinities, to higher-than-normal salinities. This, along with decreased flows from our rivers, causes water circulation to slow down. Waters began to warm, and this warmer water held less oxygen and was stressful for fish.

June: Conditions get real interesting, real quick

Warm temps and weak circulation are not typical Puget Sound conditions for June. We, and the public, were very interested in how the extreme weather was taking effect. Jellyfish began outnumbering the crunchy, more nutritious zooplankton we normally find, making it harder for wildlife to find sustaining meals, and adding to the stress caused by warm water and low oxygen levels. Massive Noctiluca and other phytoplankton blooms appeared across Puget Sound in response to low river flows from the drought.

July: Small plants make big stink on beaches

The Blob fully infiltrated Puget Sound in July. This gave us warm water temperature readings at every depth throughout the Sound. From the air, the water looked like someone spilled green slime into Puget Sound. In fact, these were huge mats of small plants, what our scientists call "macro-algae," floating throughout the Sound, Dyes Inlet and Samish Bay. These caused a smelly situation as they washed ashore and piled up in huge rotting heaps, leading to swimming closures on some beaches.

August: Millions of jellies take center stage

By August the public and media took notice of the major influx of jellyfish. Waters were warm, salty and fairly stagnant due to record low river flows. Massive jellyfish patches stretched hundreds of feet long all across Puget Sound. While other marine wildlife were stressed by our marine conditions, the warm water was ideal for these jellies. Red-brown algae blooms were abundant across the Sound. We all began asking, "Is this what climate change will make the new normal in our region?"

September: Jellies flourish in record temps

Huge jellyfish patches continue throughout the Sound, showing up in unusual places and reaching peak numbers. Despite the little rain that returned to our region, the arrival of fall did not mark an improvement to our marine conditions. Water and air temperatures remained at record highs, and river flows remained extremely low. Warm waters and sunny conditions fostered green tides throughout the Sound, which caused another wave of stinky tides along some local beaches.

October: Finally, tides turn toward normal

After a long, hot and grueling summer, October brought welcomed cool air and rainstorms. As the rivers that feed the Sound recovered their flows, Puget Sound got a much needed dose of relief as a result. This marked a turning point in conditions, and we finally began seeing closer-to-normal data readings. Even with conditions trending toward normal, waters remained warmer than usual for this time of year. Uncertainty continued, as El Niño and the Blob were both likely to keep waters warm throughout winter.

November & December: As rain rejuvenates waters, storm runoff hits Puget Sound

The winter months brought torrential rains rushing over our landscape, down our rivers, through our storm drains and out into Puget Sound. Although this improved temperature conditions and greatly helped with water circulation, it dumped huge amounts of sediment and stormwater runoff into the Sound. Snow built up in the mountains and even the Blob began fading.


This brings us to today 

El Niño is still at the equator and big questions remain. Will the snow stay in the mountains or come down early like last winter? Will Cascade snowpack reach normal levels? Will the Blob return, stronger than ever? Will we face another drought? Will climate change make extremely warm years more common in the future? Our scientists are anxiously watching Puget Sound to see how things shape up. Every month, as we fly, we monitor and take the pulse of Puget Sound.


What's Eyes Over Puget Sound?

Eyes Over Puget Sound combines high-resolution photo observations with satellite images, ferry data from travel between Seattle and Victoria BC, and measurements from our moored instruments. We use a seaplane to travel between our monitoring stations because they are so far apart. Once a month, we take photos of Puget Sound water conditions and turn those out, along with data from our stations, in the monthly Eyes Over Puget Sound report.

Thursday, December 24, 2015

A foot of water can make or break a King Tide

By Hugh Shipman, Puget Sound coastal geologist, Shorelands program


King Tides are overtaking a shoreline near you

Help scientists track and document King Tides this year! The King Tides Photo Initiative, which is going on now, is aimed at getting people to take photographs during unusually high tides and share them.

Tracking King Tides shows us how future sea level, which is expected to rise significantly during the coming decades, will impact our coastal communities. The projected sea level rise, caused by climate change, will make the extreme high tides we’re chasing now become increasingly common.


“King Tides” are defined as the highest tides of the year. In Washington, these phenomenal tides usually occur in December and January. While we work hard to predict the true King Tides; sometimes those on the schedule turn out not to be the highest tides of the winter, even if they are very high tides. Let’s find out why…


Many things make King Tides hard to catch 

Some of you may have tried to help us document King Tides this year and had the experience of being a bit underwhelmed by the high tide you observed. It can be disappointing to go out at the crack of dawn on a day with a projected King Tide, only to see the same ol’ high tide you’re used to seeing. Then, it can be extra upsetting to see news of a truly spectacular high tide a week later when you weren’t expecting one at all.

What’s going on? King Tides can be tricky to predict and catch. The highest tides of the year may not necessarily occur when we expect them. This is particularly true this winter as the strong El Niño is raising water levels, and making King Tides difficult to pinpoint.

Although we have long been able to make very precise predictions of future tides, these are based on the position of the earth relative to the sun and moon, and do not reflect contributions from the ocean or weather. Factors such as wind storms, atmospheric pressure and ocean conditions are very difficult to predict far in advance, and can significantly influence water levels. Who in Washington hasn’t experienced our weather forecast changing drastically from day to day—or even minute to minute?! These same factors can throw a wrench into King Tide predictions by producing water levels that are a foot lower or higher than expected.


Tuesday, September 22, 2015

Carbon caps around the world

By Andrew Wineke, Ecology Communications 


In July, Governor Jay Inslee directed Ecology to craft a regulatory cap on carbon pollution, using the state’s authority under the Clean Air Act to limit emissions of greenhouse gases in Washington. 

This week, we formally kicked off the rulemaking process to develop the cap. Over the next several months, we’ll be holding a series of public meetings and hearings, and gathering input from industry, environmental groups, tribes and people just like you.

It’s too soon to say exactly how that carbon cap will work or what the system will look like. But while this will be completely new for Washington, if you look around a little, you’ll see that carbon caps have been around for some time now all across the world.

Cap and trade or other carbon limits are already at work in California, British Columbia, much of China, the entire European Union, nearly every Northeastern state in the U.S., and other places.

What we come up with for Washington won’t look exactly like any of these systems. We need to develop an approach that fits Washington’s economic and environmental needs. Nevertheless, there are lessons we can take from many of these systems, and looking at how other states, provinces, cities, countries and regional organizations have tackled this challenge should give us confidence that capping carbon pollution can be done successfully.

Here’s an overview of some prominent carbon policies, along with links for more information:

British Columbia

Our neighbor to the north passed a carbon tax in 2008, assigning a price to every ton of emissions generated in the Canadian province. In 2012, that tax raised $1.2 billion (Canadian), which was offset by lowering other taxes. British Columbia started the tax at $10 a metric ton, and gradually raised the tax to the current $30 (Canadian) per metric ton of carbon dioxide– about $22 a ton in U.S. dollars ­– allowing residents and businesses to take measures to adapt and reduce their carbon pollution.

Independent estimates have found that by 2020 the B.C. carbon tax should reduce carbon dioxide emissions in the province by 3 million metric tons a year – equivalent to taking about 787,000 cars off the road.

For more information, visit the British Columbia Ministry of Finance.

California

The Golden State instituted a cap and trade system in 2013, covering carbon dioxide and other greenhouse gases. Power plants and other major emitters in the state were awarded emissions allowances, while additional allowances were auctioned off (raising $969 million in 2014, and currently priced at about $12 a ton). As the name “cap and trade” implies, companies that have excess credits are able to sell or trade them.

The cap is gradually ratcheting down by 2-3 percent a year, pushing the state to reduce its overall greenhouse gas emissions to 1990 levels by 2020. In 2015, the program expanded to include gasoline and diesel wholesalers.

For more information, visit the California Air Resources Board.

Northeastern U.S.

In the Northeastern United States, nine state governments joined together in 2008 to create the Regional Greenhouse Gas Initiative, or RGGI. The participating states are Connecticut, Delaware, Maine, Maryland, Massachusetts, New Hampshire, New York, Rhode Island, and Vermont, with a combined population of 41 million people (New Jersey was also a member, but withdrew in 2011).

Although RGGI is a cap and trade system, it operates somewhat differently from California’s version. The Initiative covers only carbon dioxide emissions from large power plants. And, instead of issuing these plants allowances at the outset and allowing them to buy additional credits, RGGI auctions almost all of the allowances and power companies have to bid on the amount they need.  Proceeds from the auctions, now a total of $2.2 billion, fund renewable energy projects and conservation measures.

Like California’s system, RGGI ratchets down the number of allowances each year by 2.5 percent until 2020. In 2015, the cap is 66.8 million tons. A report published in August found that RGGI has already reduced emissions in the region by 24 percent.

For more information, visit the Regional Greenhouse Gas Initiative.

European Union

The biggest carbon pollution cap in the world today is the European Union’s cap and trade system, which covers 500 million people in 31 nations. The program aims to cut emissions to 21 percent below 2005 levels by 2020.

The EU system includes power plants and major energy users that account for about 45 percent of total EU emissions, including more than 11,000 businesses and, notably, commercial aviation in the region.  The system gives away about half of the available allowances, then auctions the rest, with the cap ratcheting down by 1.74 percent each year.

For more information, visit the EU Emissions Trading System.

China

China is sometimes portrayed as an obstacle to significant worldwide carbon pollution reductions. However, the world’s second-largest economy has invested heavily in renewable energy and is experimenting with a cap and trade system in many of its most important regions.

In 2011, China launched a series of seven pilot programs establishing carbon trading systems in cities and provinces, with a goal of moving to a national system in 2016. The regional systems include Beijing, Tianjin, Shanghai, Guangdong, Shenzhen, Hubei and Chongqing. The design of the regional systems varies, but each covers between 35 and 60 percent of the total emissions within its jurisdiction.

For more information, visit the National Development and Reform Commission. 

Thursday, July 30, 2015

Puget Sound waters left sweltering after double punch from the drought and the Blob

By Jessica Payne, Environmental Assessment Program communications manager


Everyone in Washington is feeling the heat this summer, and Puget Sound is no exception. It's been hot and dry, with all kinds of weather records being set. These unusually hot temperatures don't end at the water's edge. We're also seeing the record-breaking warm water temperatures from “the Blob” of North Pacific Ocean water that made its way through the Strait of Juan de Fuca and into Puget Sound late last year.

“The Blob entered Puget Sound on a massive scale in the fall of 2014 and rapidly changed conditions for temperature and also oxygen,” said Dr. Christopher Krembs, Ecology senior oceanographer. “We’re measuring water temperatures 4° F higher than normal from our past 25 years of record keeping. We’re seeing the warm water everywhere, from Olympia to Bellingham.”

Monitoring suggests that these warm conditions are having many negative consequences on the Puget Sound marine environment. This year we've seen increasing harmful algae blooms, increasing and early shellfish closures, lower dissolved oxygen levels, and unfavorable conditions for salmon and other cold-loving marine species.

Why is Puget Sound warm?

Puget Sound waters have been hit with a double-whammy. Late last year, "the Blob" Was followed by an extremely warm winter and our usual snowpack didn’t form in the mountains. We rely on this melting snow to drive our river flows in the spring and summer. Without snow to melt and flow down our rivers, Puget Sound does not have enough estuarine circulation to push the Blob out of Puget Sound. Decreased circulation can lead to low oxygen conditions and allow pollution to hang around longer.

Monday, July 27, 2015

Washington’s future is parched

Take a look at this map of Washington and you’ll see that nearly 99 percent of the state is in a severe drought. Streams are low, fish and farmers are stressed, and wildfires are raging statewide.


Warmer conditions in Washington mean increased risk of drought, no surprise there. What might be surprising, however, is how much our changing climate has already impacted water supplies in Washington. Since 1950, the average snowpack on April 1 (our annual baseline in the Cascade Mountains), has decreased by about 20 percent.

Amy Snover, the director of the Climate Impacts Group at the University of Washington, told KUOW in April 2015, this year’s weather is what global warming looks like and we’ll see a lot more of these (droughts), more frequently, as we go forward. Scientists warnthat climate change could deliver “megadroughts” to the West, the likes of which haven’t been experienced in more than a thousand years.

Washington Wildfires

Catching fire

This past winter, warm temperatures meant that precipitation fell as rain instead of snow. Climate change modeling indicates these conditions are likely to become the norm in the decades ahead, meaning less snowpack and more frequent droughts.

As a result, forested areas are expected to dry out earlier, setting up wildfire conditions – just as we’ve seen this summer. Climate scientists predict the area burned by fire each year to double in the Northwest by the 2040s and quadruple by the 2080s because of climate change.

What will that look like? Look around – the Northwest Interagency Coordination Center has reported 29 large fires in Washington this year and about 1,000 total fires. Washington’s Department of Natural Resources has responded to 577 wildfires that have burned more than 73,000 acres this year.


Statewide, our weather temperatures are running 7 degrees above normal. As a result, river and stream temperatures are rising. The graph above illustrates the current high temperatures compared to the 7-year median. As of July 10, more than 80 percent of Washington’s rivers and streams are running below 10 percent of their normal flows.


Water reaches a drought-stressed potato field for the first time in weeks.
 

Climate change and Washington’s economy

To get a sense of how climate change may impact Washington’s economy, look at how our state’s agricultural industry is coping with 2015’s unprecedented drought. Weekly reports from the U.S. Department of Agriculture indicate that Washington’s agricultural producers are feeling the effects of the hot and dry conditions.

For example, only 32 percent of our state’s winter wheat crop, and 21percent of the spring wheat crop is rated in “good” or “excellent” condition. Many non-irrigated crops and pastures are “stressed” or “struggling,” the USDA reports. Some farmers are abandoning lower-value vegetable and plantings so that the limited water available for irrigation can be used for higher-value crops, or to preserve perennial crops.

Silver linings?

Climate change isn’t hopeless. We can take steps to prepare and to improve our state’s resiliency to drought, fire and other climate impacts. Again, our response to this year’s drought shows some of the steps we can build on in the future.

Along with working to address the immediate impacts of the drought, Ecology is working with irrigation districts and water rights holders to improve water supplies and our transmission capabilities.

This year, the Legislature approved $16 million in funding to help ensure reliable public water supplies, augment water supplies for farmers and provide water to support stream flows for fish. A portion of the money will allow Ecology to provide grants to state and federal agencies, cities, counties, other local governments and some Indian tribes for projects such as developing alternative water resources, purchasing or leasing water or water rights, and building water transmission pipelines.

The conditions we’ve seen in 2015 may offer a glimpse of the new normal in the years ahead. The challenges we’re facing now are a dry run – a very dry run in most of the state – for the tools and techniques we will need to manage a warmer, drier Northwest.

Stay tuned for more Ecology blogs on climate change.